RESOURCES
EXECUTIVE SUMMARY
Batteries used in consumer products are mini chemical plants that can store and release energy consistently over a long period of usage. As requirements get specific, so does the battery. When the application demands extraordinary performance, battery packs go beyond consumer or regular industrial grade to mission-specific. A critical understanding of the cell’s characteristics and its relation to the design and implementation of the mission-specific battery pack is needed.
This application note discusses the design and implementation of high discharge rate battery packs with emphasis on lithium iron phosphate (LiFePO4), using data published by the manufacturer.
TYPES OF BATTERY CELL
Most cell types available today can be called high performance for valid reasons, but just a few are suitable for high-rate industrial-grade battery applications. To select the most suitable battery cell, a quick overview of a few critical features is helpful. The table below provides a summary of key performance and life characteristics.
Although compact and lighter battery cells seem to be a common requirement for all the applications, other attributes of the battery cell quickly take precedence for industrial applications, especially when a high discharge rate is needed. Battery cell specifications and performance are related. The selection of a battery type is primarily based on the energy density measured as a function of available capacity for a given volume or weight.
Lithium polymer cells outperform all others in energy density, but they are not the most robust. Nickel-cadmium and Nickel-metal Hydride have some attributes suitable for rugged industrial applications but have fallen out of favor with the advent and proliferation of Lithium iron phosphate batteries.
Cell type (chemistry) |
Energy density WH/Liter |
Self-Discharge (%/month) |
Cycle Life (Cycles) |
Peak discharge Rate (Note 4) |
Charge duration (hours) |
Common applications |
|
Valve- regulated lead Acid-flooded gel (VRLA) |
80-90 |
3-20% |
300 |
>50°C |
6-12 |
Automotive, Off-road vehicles, general industrial |
|
Absorbent glass mat (AGM) |
80-90 |
3-20% |
500-1000 |
>50°C |
6-12 |
Consumer, telecom base stations, general industrial |
|
Ni Metal Hydride (NiMH) |
140-300 |
50-80% |
2000 |
10-20°C |
2-3 |
Hybrid EV, power tools |
|
Nickel Cadmium (NiCD) |
50-150 |
10% |
|
10-30°C |
2-12 |
Power tools |
|
Lithium-Polymer |
250-750 |
2-5% |
1000-2000 |
10°C |
1-2 |
Phones, Laptops, consumer electronics |
|
Lithium iron phosphate (LiFePO4) |
300-350 |
2-5% |
2000-6000 |
40-50°C |
1-2 |
Industrial/Medical/Military backup, grid stabilization |
Notes:
- Energy density is measured in two ways-volumetric (capacity/volume) and gravimetric (capacity/weight). In this application note, a combination of the two metrics is used as a guide. Cell manufacturers’ data should be consulted for more accurate and detailed information.
- The cycle life guideline here is when cells are charged and fully discharged every time, which may not be the case in every backup application.
- Peak discharge rate measured in multiples of the cell’s nominal rating. For example, a cell with a 1AH rating delivering 10Amp is said to be discharged at a 10°C rate. A 2.2AH rated cell delivering 100A would be discharging at a 45°C rate. The focus of this application note is at rates higher than 10°C
HOW TO SELECT A BATTERY CELL OR BATTERY PACK OF CELLS
From the above table, it seems like NiMH and both Lithium types are suitable for high-rate battery packs. However, based on the ability of LiFePO4 cell’s ability to work at a much higher temperature and superior cycle life, it is the most suitable cell type for high-rate battery packs.
An additional factor in favor of LiFePO4 is that they have no known safety issues.
There are multiple methods of analyzing battery cell characteristics for a given end-use. One can use the manufacturer’s published data and performance curves to design the battery pack, use advanced equivalent circuits and simulation means, or test a battery cell or pack of cells for the required specific conditions. Care must be taken when a large number of cells are integrated into a series of packs and parallel banks. While LiFePO4 batteries present much less risk of dramatic incendiary events, when they are overcharged, than other lithium-ion cell types; when connected in series or parallel they still require effective battery management circuitry. Hence some minimal protections need to be in place before charging or discharging a pack of battery cells.
For a quick discussion on the cell specifications, the manufacturer’s published data will be used. The set of specifications below is taken from A123’s LiFePO4 cell.
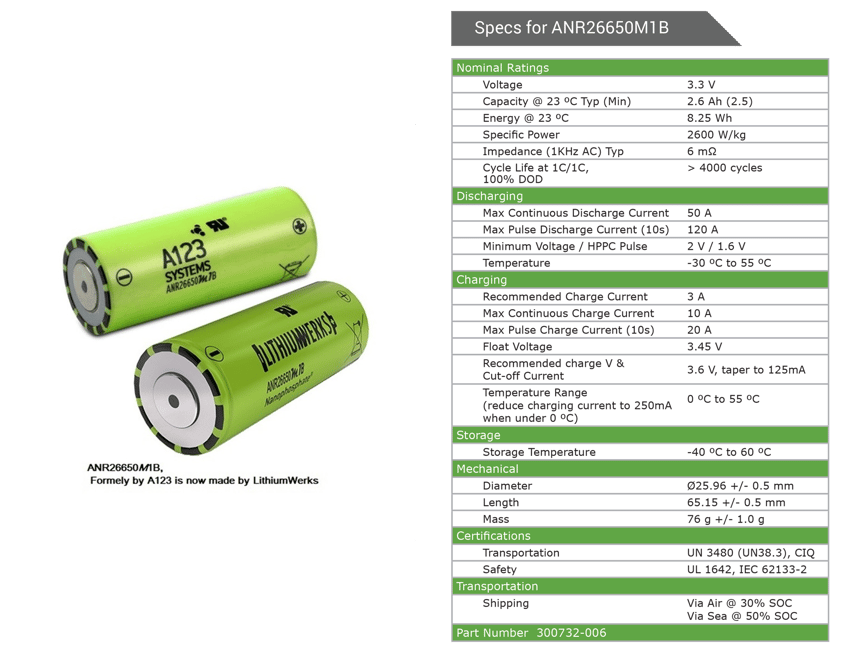
Fig 1: A123’s LiFePO4 cell
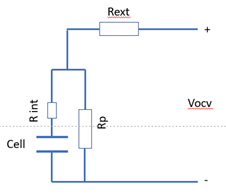
Fig 2: Cell simplified equivalent circuit
Nominal voltage (Vnom): This is the rated value of the cell, which is only for reference, helpful to quickly estimate how many cells will be needed to achieve the desired terminal voltage of the battery pack. The battery cell voltage has several dependencies and has a useful range of -20% to +15%. The nominal voltage rating by the manufacturer does not factor in the rate of discharge or the age of the battery cell.
Open circuit voltage (Voc): This is a parameter that is strictly defined by the cell chemistry and the manufacturer. It’s the voltage across the battery cell when measured with no load on it. The actual value of Voc depends on the state of charge. Overcharging the battery cell to get a higher voltage or more capacity is not an option.
State of Charge (SOC) and Depth of Discharge (DoD): When a cell is fully charged according to the manufacturer's method, it is at 100% SOC. When it is fully discharged and has depleted all the charge previously added to it, it is at 0% SOC. At all other conditions, it is between the two SOC values.
When the cell is discharged from an initial value of 100% SOC to 0% SOC, it has gone through a cycle of 100% depth of discharge (DoD). The cell voltage would have changed from its maximum to its minimum and sometimes beyond the minimum. From an application perspective, when the provided cell capacity is exactly equal to the application need, the cell always goes through 100% DoD cycles.
As we will see later, starting at 100% SOC is always a good idea, but planning on a 100% DoD is not a good idea, since it does impact the cycle of life. In other words, providing more cells than needed, and installing a higher capacity pack that provides for better cycle life and other secondary efficiency benefits. There’s more useful information on this aspect as we review actual high-rate discharge test data.
Cell capacity (AH): This is a measure of the energy stored in the cell, which is also a measure of its ability to deliver energy to a load. If a cell is rated 2.5AH, it is expected to deliver 2.5A for one hour, at which time, its SOC is 0%. If the rate of the drain is half, it will deliver current for twice as long. However, if the drain is at a twice the rate (5A), it will not deliver current for lesser than a half-hour, due to the increase in loss in its internal impedance, the loss is a function of current squared. As we will learn from the detailed test data, the manufacturer’s data on nominal capacity is a good guide, but deep-diving into it and conducting some tests at actually needed conditions give a much more reliable number. For the specific cell in the discussion, the manufacturer’s specification suggests a capacity of about 8WH, but actual data at the rate needed for the application downgrades that to about 6.5WH, a good 20% drop.
Internal impedance (R int): Every cell has a certain intrinsic impedance which appears like a series resistor as shown in the cell equivalent diagram. The actual value depends on the state of charge, temperature, and age of the cell, but the manufacturer’s data is a good guide and starting point. A value of 6milli ohm suggests that when 10A is drawn out of the cell, about a 60mV drop will occur within the cell. R is not absolute, but it is easy to verify its impact at a high-rate discharge by simply treating it as a resistor and checking for its voltage drop at the highest rate needed in the application. In addition to voltage drop, it has a power loss, estimated by the usual I2R method. In normal discharge rates, both voltage drop and power loss are not significant, but at high rates, their impact becomes quite significant. Although R int is represented by a resistor, its relationship to the chemical state of the cell is complex, hence its value keeps rapidly changing as the cell drains out. The detailed impact of R is discussed in the section on high-rate discharge.
With the A123 cell in the discussion, the power loss at 100Amps would be 60W. This huge loss cannot be sustained for a long period, which thankfully won’t happen when the cell is delivering 100Amps. Theoretically, the cell will last only about a minute at which point its terminal voltage becomes too low and its temperature becomes too high eventually heading into 0% SOC, and will no longer deliver any significant current. In other words, there is an un-intended self-limiting mechanism in place but in a real application, one should never let the cell reach this undefined boundary condition.
R int will also vary because of rapid heating in the cell due to I2R loss.
REQUIREMENTS OF BATTERY CELLS FOR HIGH DISCHARGE RATE BATTERY PACKS
Most battery cells are capable of discharging at a high-rate relative to their nominal rate. For example, the automotive battery of either regular lead acid or AGM rated at a nominal 48AH, delivers up to 650 amps when starting the car, which translates to roughly 14X of its nominal rating, or simply stated it delivers starting current at a 14C rate. The key to its performance is not just to deliver these high currents multiple times a day, or a few thousand times over its life, it should also maintain its terminal voltage high enough to drive the starting motor till the engine picks up speed and sustains the system.
Its ability to maintain a certain terminal voltage depends on the value of its internal impedance. It is low enough when new and gradually deteriorates (becomes higher) as the battery ages. That makes the internal impedance critical. The impedance depends on several factors, of which temperature is one of the most critical. Hence, the battery is stated for specific cranking amperes when cold labeled as cold-cranking amps.
In industrial backup systems, a high rate of energy delivery is needed for a variety of loads. Unlike an automotive starting, the peak energy demand can be repetitive. This aspect needs to be carefully analyzed as it can have a significant impact on the backup time and losses in the battery. In addition, the battery will age faster than in steady-state use, all other things being equal.
Before we start working with the application it is important to recognize a few cell parameters that are critical to high-rate battery discharge and factor them into the pack design.
A simplified equivalent circuit diagram of a cell helps in identifying its critical features as shown below along with a brief commentary on those parameters.
CRITICAL OBSERVATIONS ON LIFEPO4 BATTERY CELL PERFORMANCE AT A HIGH DISCHARGE RATE
While 40°C and above is too high for any cell type, testing the cell at this condition helps to understand the impact of high stress, rapid temperature rise, and its secondary impact on the impedance of the cell. At this condition, the depletion of energy is so rapid, that external effects like temperature have very little impact. To understand cell behavior at elevated currents, the following test plots present data measured well above the cell’s specified 50A limit for continuous discharge.
Since cell voltage and internal impedance are the most crucial to achieving a target performance and determining the final cell count, a few critical observations from actual test plots will be very helpful.
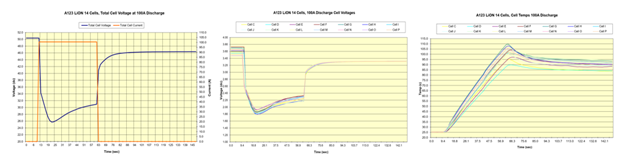
Fig 3: Cell voltage plot at 100Amp (40°C) of a 14-cell series stack at room temperature
The total impedance of this cell pack is 14*6=84milli ohm nominal and the cell is fully charged to 3.7V, resulting in a pack voltage of 52V. Due to voltage drops in the shunt and series FETs, the initial pack voltage reads slightly more than 50V.
As soon as the 100A draw starts, the cell pack and cell voltage drop abruptly to about half of the initial value, translating to about 1.8V per cell, well below the recommended minimum.
At this loading the cell is packed is dissipating close to 850W internally causing a rapid temperature rise, which appears to make the cell more efficient, dropping its internal resistance and increasing its terminal voltage from 1.8V to about 2.2V. the temperature of the cell's external wall rose to 110°C and the test was stopped. The cells survived well through a whole lot more testing, but this test gave some valuable data, which are:
- This cell would need a huge number of them in series to achieve the target voltage, which would have worsened the internal voltage drop and power loss offsetting any gains made by building up the stack.
- The internal power loss of 850W is more than a third of the pack’s load of 2640W
- This cell is not suitable for 100A (40°C rates) regardless of how it is configured
BATTERY CELL CAPACITY DEGRADATION AT A HIGH DISCHARGE RATE
While designing the battery pack, the first step is to provide the initial capacity and proper terminal voltage needed by the application. However, battery packs are a high investment sub-system and need to be designed for reliable service for years down the road, ensuring the capacity loss is minimized by pack design and there is adequate margin provided for in the design, subject to size, and weight and cost considerations.
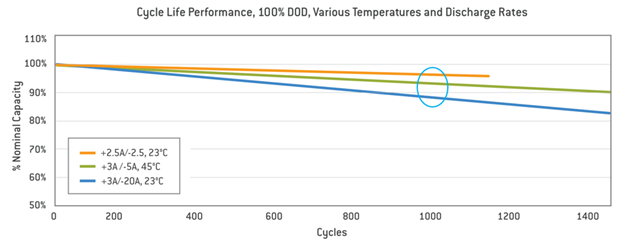
The most important aspect of capacity loss is cycle life and depth of discharge. Assuming every application needs full capacity delivered each time, a curve like the one below can be used as a sound basis for estimating capacity loss over time. In this example data discharging at 20A (8C) rate makes the cell lose about 12% of its initial capacity after 1000 cycles. This condition represents the exact value in the case study discussed further.
Based on this data, if the application needs a 3000-cycle run life, at least a 45% buffer capacity should be provided in the pack design by adding that many cells or a means to economically replace the cells down the road should be provided.
HIGH-RATE BATTERY PACK DESIGN
Once the cell attributes are understood and characterized at high-rate discharge, the actual battery system design can proceed with the following general methodology.
- Calculate the capacity needed for the application
- Estimate cell count based on the nominal capacity
- Provide buffer capacity (more cells) for projected loss of capacity over the life
- Estimate terminal voltage, determine series count in the cell pack
- Estimate voltage drops at maximum discharge rate and checks for minimum available voltage meeting target spec
- Factor in temperature and production lot variations and make one final adjustment in the series count
- Estimate the weight and volume of the battery pack (factor in the electronics, wiring, and enclosure overheads)
- Create a comprehensive specification and let the experts create the actual battery pack
- Budget for development and qualification efforts and more importantly field trials with actual system load.
CASE STUDY: SELECTING A BATTERY PACK FOR AN AIR LIFT SYSTEM
The application involves powering DC motors of an air lift system. The battery pack run time needed is about 5 minutes during which the current draw varies significantly, but the terminal voltage needs to be maintained within about a 2-volt window. The end-use mandates weight and size constraints while needing several thousand cycles of operation to justify investments in development and qualification. Being outdoor most of the time the battery pack is exposed to temperature extremes, with shock and vibration associated with an air lift system.
LiFePO4 cells are probably the only ones that can meet the stated conditions. In the process of developing this battery pack, a trade-off performance and physical aspects discussed are also presented.
GENERAL SPECIFICATIONS:
Vnom/Vmin 44.4/42.5 Volts
Average current 60 Amps
Average 2664 Watts
Min Run time 300 Seconds
Energy used at an average 205 WH
Target weight 8.5 Lbs.
Additional details of the application current draw translated to battery capacity needed are shown in the diagram below.
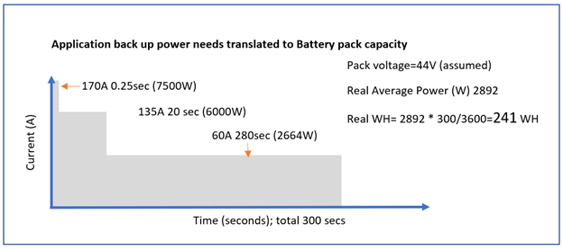
Fig 4: Application needs translated to battery pack capacity
BATTERY PACK DESIGN CONSIDERATIONS
Once the pack configuration is determined, a detailed design can follow to determine features needed outside the cell pack like charge/discharge control, FETs to achieve that, shunt resistance for current sensing, and overall performance assessment against stated requirements.
A final round of validating initial selections and providing for any buffers and cells again will complete the pack design, enabling detailed specifications effort for actual implementation.
A typical simplified diagram of the power circuit of the proposed battery pack is shown below. The minimum needed parts in the pack in the path of load current are included, but the charge and battery management electronics are not.
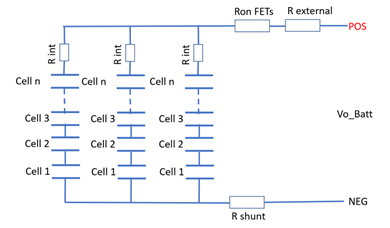
Fig 5: Simplified diagram of a battery pack
In the above example, after checking for minimum voltage available and manageable temperature rise, the cell count needed for the pack is estimated roughly as total capacity needed / cell capacity= 241/8=30 cells.
This is the absolute minimum cell count based on its capacity at light loading and when the cells are new.
Additional adjustments should be made based on the cell capacity at a higher current, which is about 6.5WH, as shown in figure 6. This translates to a revised cell count of 241/6.5=37.
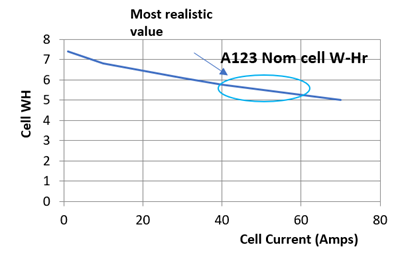 Fig 6: Realistic cell capacity when discharging at high-rate
A further revision may be needed after determining the number of cells needed in series to achieve the target voltage as discussed below.
REVIEWING BATTERY CELL AND PACK VOLTAGE AT PEAK LOADING:
The series stack needed to get the appropriate terminal voltage is determined based on cell capacity, then adjusted for voltage drop and loss factors at the needed discharge current.
The manufacturer’s specification for maximum continuous discharge is 50A. Treating this example as a continuous need, 3 parallel cells should be provided to support the initial two peaks of 170A and 135A. Ignoring the first 0.25 seconds, the next peak of 135A for 20 seconds translates to 135/3=45A per cell stack.
Determining the number of cells needed in series to support the 44V needed is straightforward. Referring to
figure 7, we see that the useful minimum cell voltage is about 3V, beyond which the cell would have lost most of its capacity. So, using 3V as the minimum, the cell series count is 44/3=14.7, which is rounded up to 15.
Estimating the cell internal drop at 45A, using the 6 million ohms as the internal resistance, yields 0.27V. The effective cell voltage is now reduced to 3.0-0.27V= 2.73V.
Reviewing the series cell count for 44V yields 44/2.73=16.2.
Another minor markup can be made to allow for the higher initial current, which is critical for the application using a motor, this stack can be rounded up to 17. With a parallel count being 3, this pack now has a maximum count of 51 cells in a 17S 3P format, resulting in a net initial capacity of 332WH.
If adjusted and marked up for capacity loss over cycle life, if we need to provide the additional capacity of 45% to support 3000 cycles, the revised capacity needed is 481 WH and the new cell count is revised to 481/6.5=74.
That will be a 17S 5P battery pack with a much larger weight and form, which needs a review with the end customer.
The key observation is that batteries are mini chemical plants and they do degrade over time. Making up for that loss has a huge front-loaded cost and weight overheads.
An additional review will be needed to determine the weight of this pack against the application target.
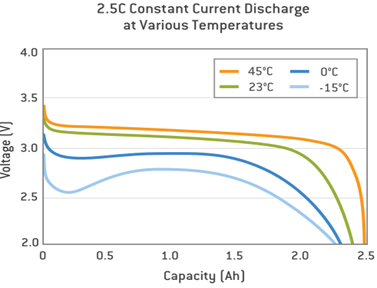
Fig 7: Useful cell voltage guide
BATTERY CHARGE AND DISCHARGE CONTROL:
A typical charge/discharge control circuit is shown below. When the charger is plugged in, the pack can be programmed to automatically begin charging or an Enable signal can initiate charging. The rate of charge is set by the BMS and the current is measured as a voltage across the R shunt.
All other charging functions like cell temperature monitoring and cell balancing and protection against overcharging and overheating are provided in the BMS.
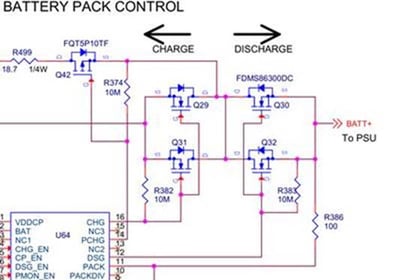
Fig 8: Charge and Discharge control system
Charge control FET requirements are rather modest. Most cells work best when charged at a low rate. LiFePO4 cells are better characterized by high discharge rates, but not as well as high charge rates. Unless the application demands, charging can be done at 0.5C or 1°C maximum. At a 1°C charge rate, it will take about 1.5 to 2 hours to build up the charge to full capacity.
Charging at higher than 1C may have some capacity reduction mechanisms that the manufacturer should be able to provide. As a guide, charging at a low rate is best for the cell’s long-term capacity retention.
Since LiFePO4 cells don’t have any significant memory effect, they will deliver the full capacity each time if charged to the full, only limited by the cell’s calendar and cycle life.
LOSS AND POWER DISSIPATION IN BATTERY CHARGE AND DISCHARGE FETS:
The charge control FETs don’t have much of a loss when passing charge current at 2.5A (1C) through it. With a Ron of 3milli ohm, the loss is 38mW.
Discharge control FETs on the other hand need detailed analysis. With the total battery pack current split into 3 cell strings handling 60A peak and 20A each sustained, the final main FET still needs to be designed to safely handle the first current peak of 170A and if there are any other Inrush currents into the system.
With the overall Impedance of the cell pack being 90- 102milli ohm per string, the effective resistance of the 3 parallel strings is in the 30milli ohm ballpark. Any external resistances should be made well below this value, preferably a tenth, say 3 million ohms, then checked for SOA at the full peak current. So, starting with the lowest Ron FET capable of handling the needed current and voltage, then paralleling 2 FETs will be a good starting point.
A Low Rds On FET like FDMS86300DC in parallel is a good choice. With two devices in parallel, effective Ron= 1.5milli ohm and the voltage drop across the FET will be 170 A * 0.0015V= 0.255V a mere 0.6% of the pack terminal voltage. Power loss in each FET at the sustained current of 60A (30A/FET), will be 30*30*0.003=2.7W.
The total loss of 2 FETs is a little over 5W, which is negligible.
The junction to an ambient temperature rise of the FET can be made as low as 11 deg/Watt translating to an effective 11*2.7=30 degrees rise of junction temperature (Tj) above ambient. When operating in a 55°C ambient environment, this FET junction is expected to be at about 85 degrees C, well below its rated 150°C.
In summary, selecting the FETs for the highest discharge rate is straightforward, and managing its voltage drop or heat loss is not a major challenge. Rds on of FETs have a positive temperature coefficient, hence their value will rise at higher ambient temperature. The effect of higher current and the I2R heating effect will raise the Rd ON even faster than expected. The worst-case ambient and system currents should be used to select the FETs.
Additional transient conditions if any can be easily verified by the SOA curves from the manufacturer’s datasheet.
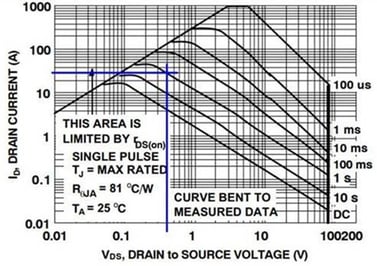
Fig 9: SOA plot of FDMS86300DC MOSFET
BATTERY MANAGEMENT SYSTEM (BMS) OVERVIEW
BMS typically includes charge and discharge control, precision circuits for cell voltage balancing, temperature, and voltage sensing and protection circuits.
To enable the above functions, the BMS needs a precision temperature compensated shunt to read the current accurately and precision voltage measuring capability.
The cell charge control should have the ability to hold the cell voltage at full charge to within 5mV of the target value to get the best performance.
High-performance BMS is best left to experts. BMS control ICs specifically designed for a certain series stack. Currently, typical Lithium-ion BMS control can manage a 15-series cell stack. Any additional cells need special handling by discrete circuits.
A typical high-performance BMS circuit interfacing with cell pack and control FETs is shown in Figure 10.
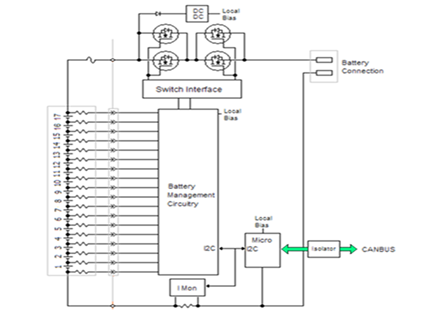
Fig 10: 15 cell BMS representative diagram with CANBUS interface
BATTERY PACK WEIGHT:
Each cell is 76 grams. The enclosure, wiring, BMS, and overheads all add up to pack weight. Allowing 24 grams of overheads per cell for convenience, we will have an effective cell weight of 100 grams. For a 17S 2P 34 cell pack, the weight is estimated at 3.4Kg (7.6 Lbs.). For the 17S 3P 51 cell count pack, it will be 5.1Kg (11.4 Lbs.).
Referring to the needed capacity of 241 WH for the application, the 17S 2P 34 cell pack provides 221WH, slightly below the needed capacity, which may be borderline on run time, but lighter and smaller.
The 17S 3P 51 cell count pack will provide 331 WH, which will have some buffer to allow for deterioration in cell capacity over time, but the user must deal with the additional weight and size and must pay for the additional cells.
While both configurations provided the needed terminal voltage critical for the system to operate, this case study demonstrates the difficulties of meeting the critical specifications of the battery pack due to the effects of a high discharge rate.
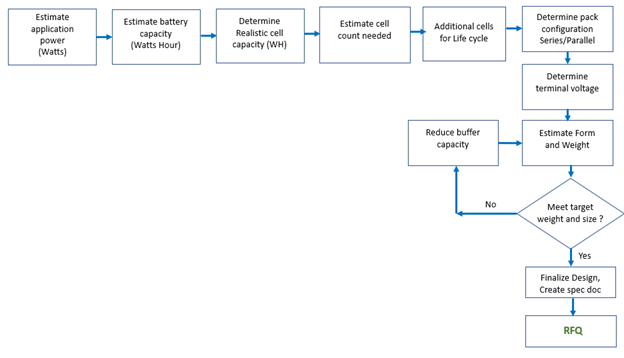
BATTERY PACK DEVELOPMENT FLOW CHART
Below the flowchart is a suggested guide to a complete definition and getting the job done by experts.
BATTERY PACK SAFETY
As energy density gets higher so does the risk of batteries developing unforeseen hazardous conditions during charge or due to a mechanical shock. Among all the cell types in popular commercial use, LiFePO4 is known to be the safest and on par with lead-acid cells. It is an inherently robust structure that makes its temperature rise much less than other cell types and practically eliminates any thermal runaway scenarios. However, protections need to be in place against accidental abuse by incorporating comprehensive autonomous protective features by electronic and passive devices like fuses and circuit breakers.
In addition, the packs should be designed and packaged following DoT and UN transportation guidelines.
SUMMARY
Battery packs for applications needing a very high discharge rate greater than about 5C need a thorough understanding of the cell behavior initially and its degradation over time.
Almost every aspect of the design has a significant relationship to size, weight, and cost. However, with the guidelines presented in this application note, a good estimate of the pack can be derived and a detailed specification document created to enable the experts to create a practical battery pack that serves the intended purpose for years down the road.
A good design will serve its intended purpose well beyond the original warranty without causing any hazardous conditions.
High-performance battery packs start with selecting the right cell following the methodology discussed here and are best implemented by people with experience and a proven track record.